Table of Contents
Supply Analyse #
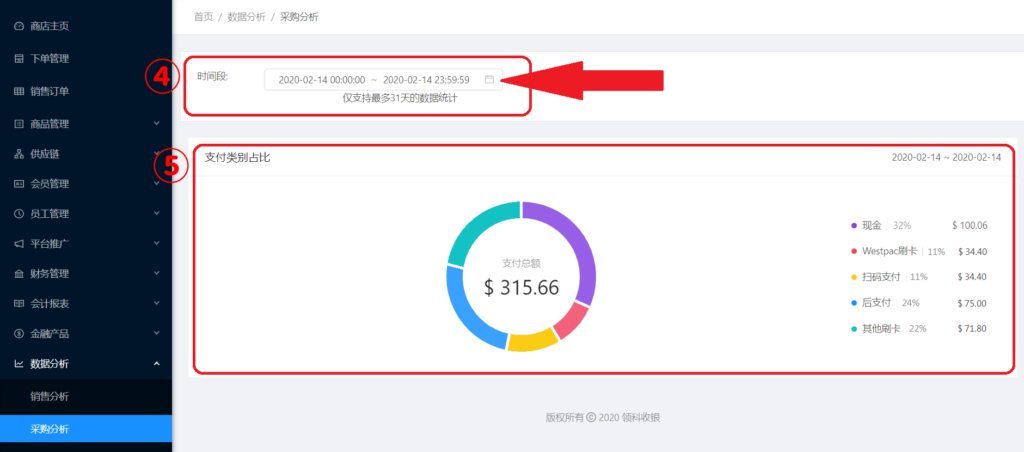
The supply payment percentages will display as a pie chart to help the user review and analyse.
(1) ④Time range only supports the data within a maximum of 31 Days.
(2) Click the calendar to choose the time range (如④Red Arrow) Payments are displayed as a pie chart(As⑤), and the right side shows the details of percentages for each payment