The user can review six basic Sales Data
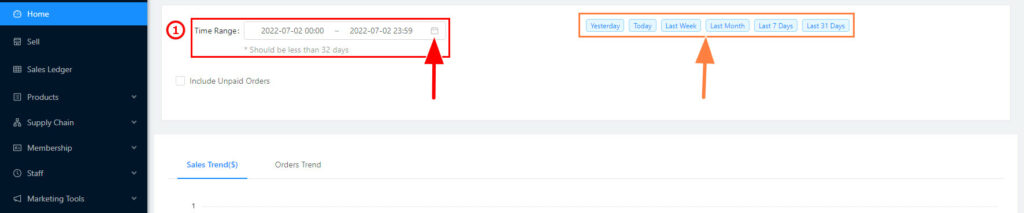
(1) Right-click the calendar option to choose the time/date period. (As①) The store main page will provide the data within a maximum of 31 days. The system will automatically choose the data for the current day.
(2) The quick period setting Icon on the top-right (As Orange Arrow), provides yesterday, today, last week, last month, last 7 days, and last 31 days options.
(3) Choosing the current period, will show the blue frame (As②)
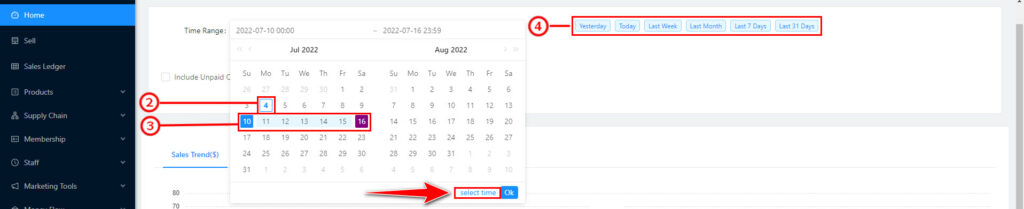
(4) Period zone shows light blue, the start time/date shows white letters with a blue background, and the end time/date shows white letters with a purple background. (As③)
(5) Period options on the left bottom provide quick settings for today, yesterday, last week, and the current month. (As④)
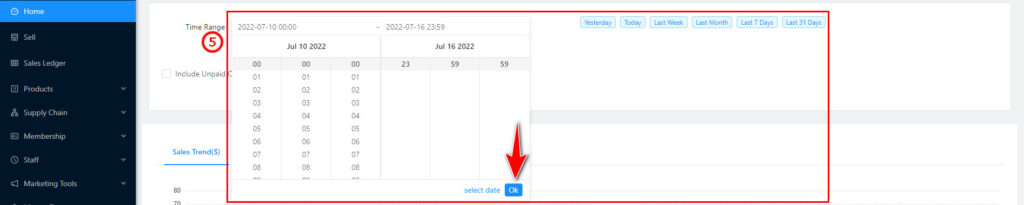
(6) Right-click the period options (Red Arrow) to choose the data for an exact hour/min/sec (⑤)
(7) Confirm the chosen data with “OK”, to show the basic sales data. (⑤ Red Arrow) (8) Sales Amount Trending: Vertical Direction shows the sales amount, and the Horizontal Direction shows the time/date, The user can review the sales of choosing period (⑥)
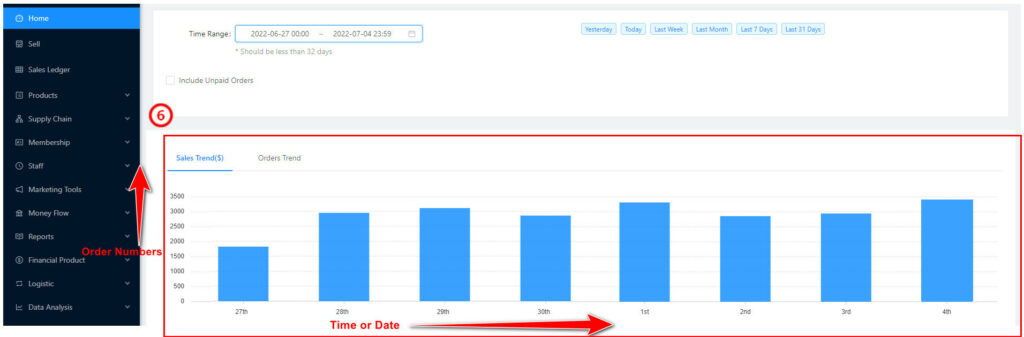
(9) Order trending Vertical Direction shows the total order number, and the Horizontal Direction shows the time/date. The user can review the order number of choosing period (As⑦)
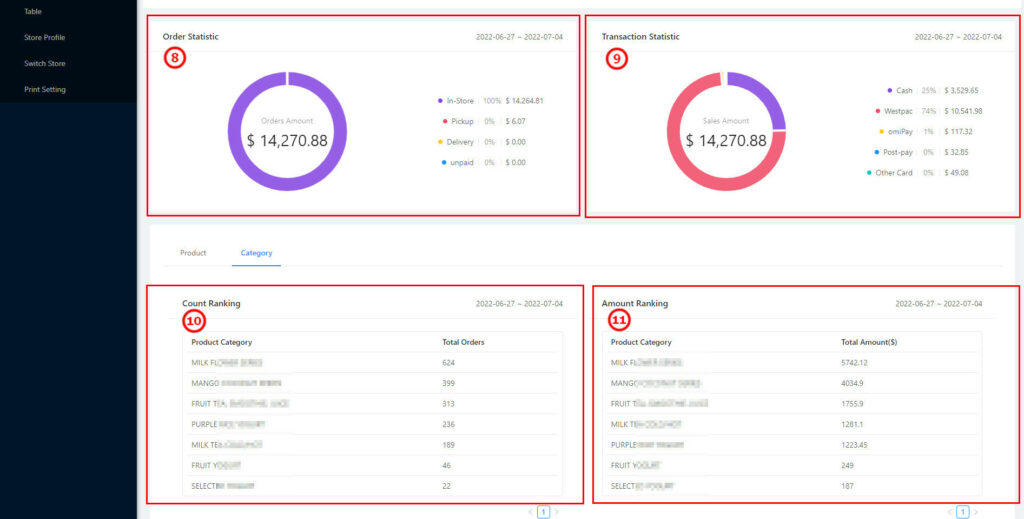
(10) Order Type Percentage: Order Category Percentages will show as a pie chart. The user can analyse the different types of percentages within the currently chosen period.
(11) Payment type percentage: Payment types percentages show as a pie chart. The user can analyse the different payment types within the current chosen period (As⑨)
(12) Sales Leaderboard: The user can review the sales amount for all products by ranking the sales number. (As⑩)
(13) Sales Amount Leaderboard: The user can review and rank all total sales amounts for sold products by ranking sales amount. (As⑪)