Version:1.1
Issued Date: 05, April 2022
Contents
1. Overview………………………………………………………………………………………………….. 1
2. App Login in…………………………………………………………………………………………… 2
3. Dashboard………………………………………………………………………………………………… 4
4. Settlement…………………………………………………………………………………………….. 10
5. Table……………………………………………………………………………………………………… 14
6. Order……………………………………………………………………………………………………… 16
7. Product………………………………………………………………………………………………….. 19
8. Print zone…………………………………………………………………………………………….. 24
1. Overview #
Linkboss is a remote-management APP, which can be installed on mobile devices, such as mobile phones and tablets. The manager can access the restaurant operation data and statistics remotely, such as order type and payment method and meanwhile implement the basic system setting for the restaurant online system.
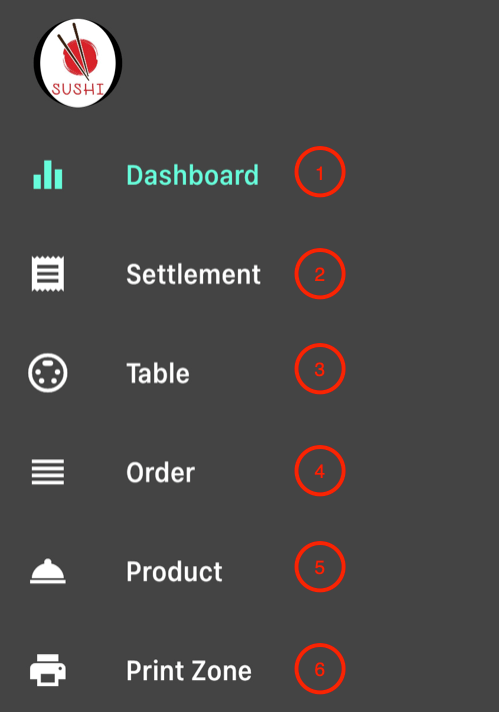
The main functions are:
1Dashboard Overview of the key data of the restaurant, including order type, payment method, the volume of orders and sales trend. The data can be searched by different dates.
2Settlement Searched the date, and the overview of the sale can be presented.
3Table quickly set the table for the online system.
4Order According to the date, search and present the statistic of order and also the details of each individual order
5Product Add, edit and modify the restaurant menu and product.
6Print Zone Add and edit the print area
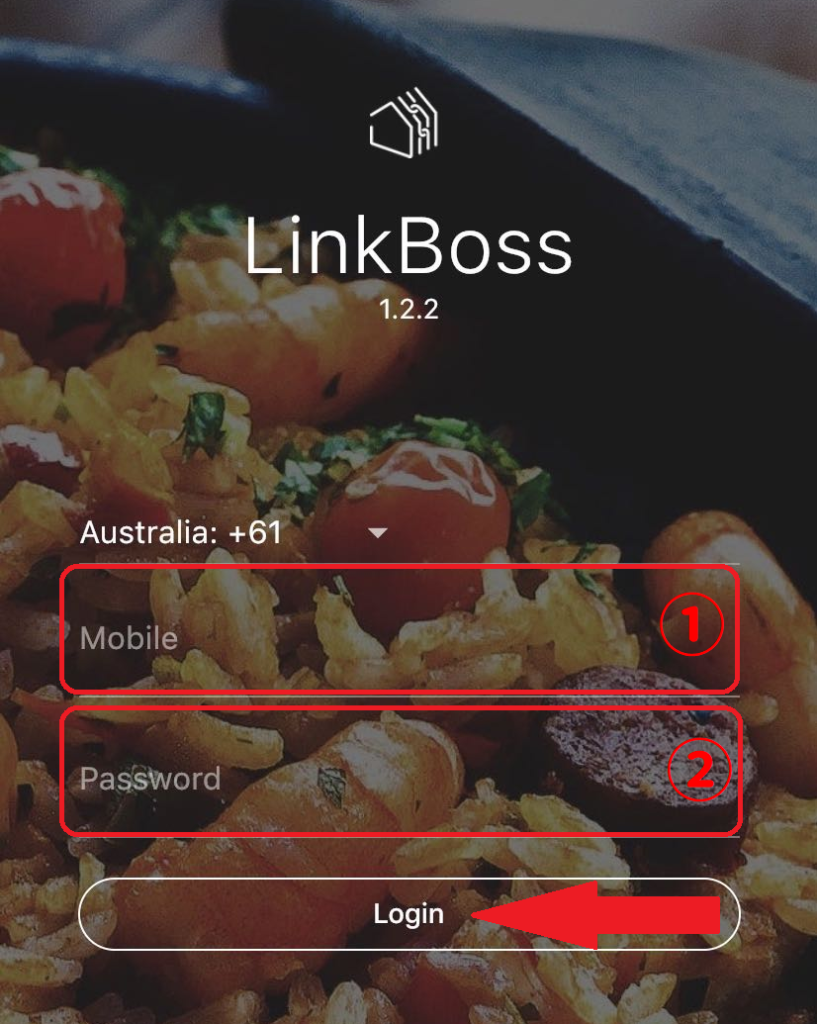
2. App Login in #
The picture below is the interface to log in to the LinkBoss APP. The manager can input the mobile phone number as a username and the password to access the APP.
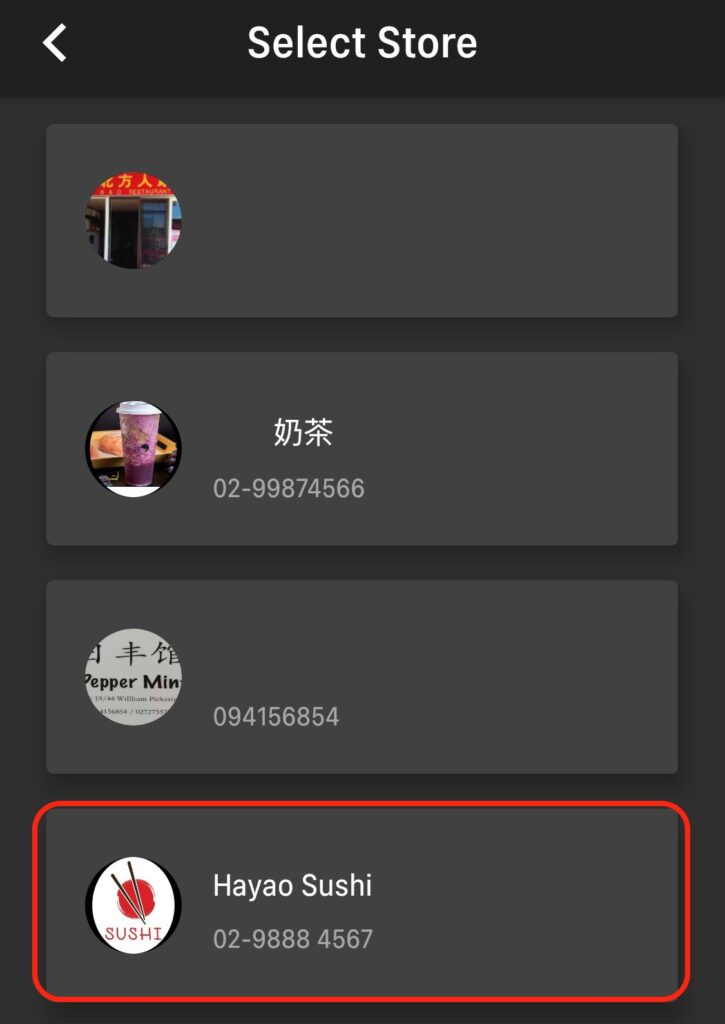
If there are multiple restaurants under the user name, the manager can see the list of restaurants and choose the restaurants.
3. Dashboard #
Three main statistics can be quickly looked through in the Dashboard tag.
- Order type and Payment method searched by date
Click the calendar icon on the top-right corner to input the date you want to check the statistic(②), the calendar is shown at bottom of the screen (3)
the data is shown in a pie chart by different categories(①):
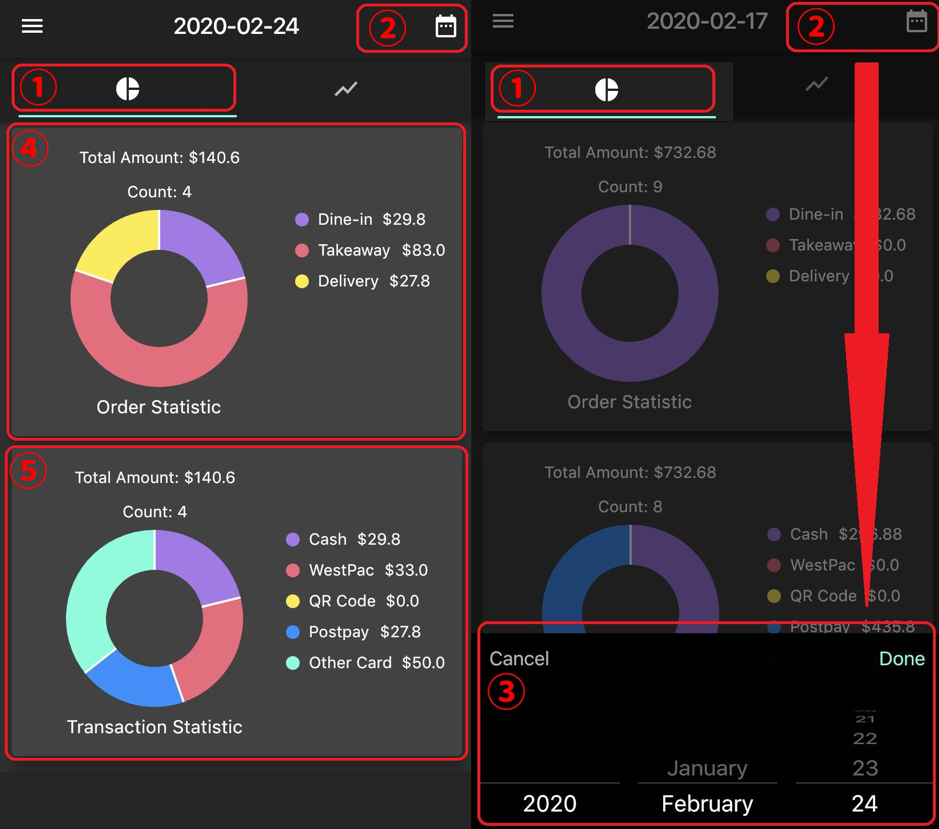
Order type: The pie chart shows the proportion of different orders from total order revenue. The order types are Dine-in, Takeaway and Delivery. (④)
Payment method: The pie chart shows the proportion of different payment methods from total payment revenue. The payment methods are Cash, Bank card, QR code payment and other payments.
- Sales Volume
Choose the Polyline icon on the top-right corner(⑥), then by inputting the date(⑦), the sales revenue on the selected date is shown by hours in two categories:
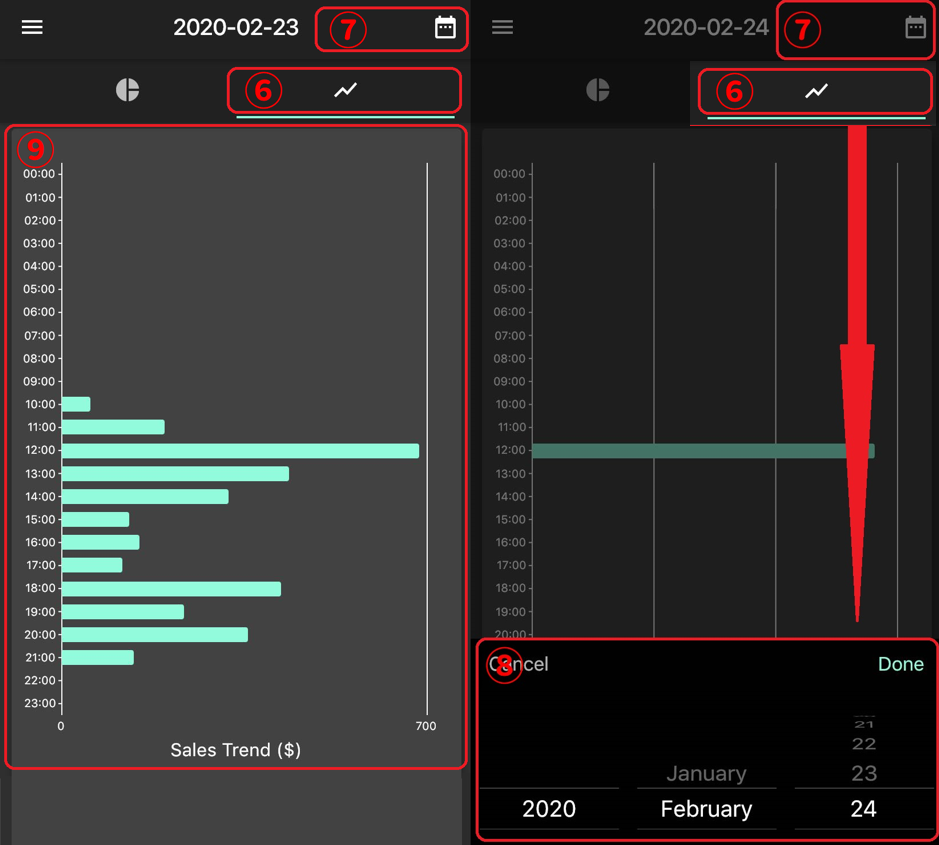
Sales trend: the horizontal bar is the sales revenue with the vertical hours’ axis. (⑨)
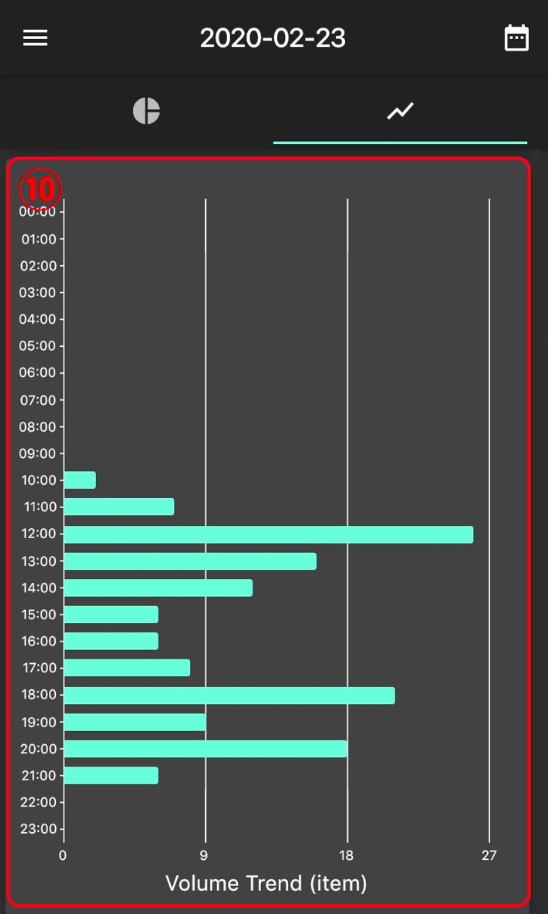
Order trend: the horizontal bar is the order volume with the vertical hours’ axis. (10)
- TOP 10 dishes and categories in sales volume and revenue
With a specific date, the data can be shown:
Top 10 dishes in volume: the horizontal bar is sales volume with vertical hours (per hour)
Top 10 dishes in revenue: the horizontal bar is sales revenue with vertical hours (per hour)
Top 10 categories in volume: the horizontal bar is sales volume with vertical hours (per hour)
Top 10 categories in revenue: the horizontal bar is sales revenue with vertical hours (per hour)
4. Settlement #
With specific dates, statistics of sales can be searched.
- Start from the calendar icon on the top-right(①), input the date(②), and all sale revenue is listed separately. (③)
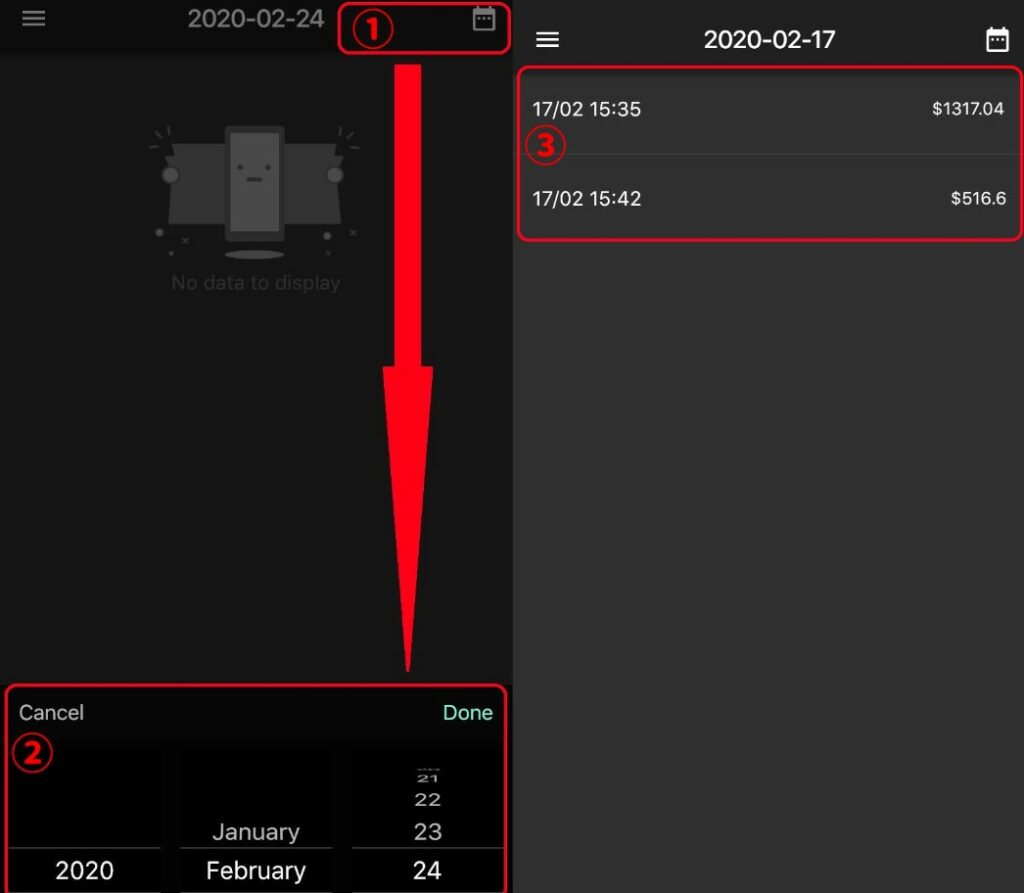
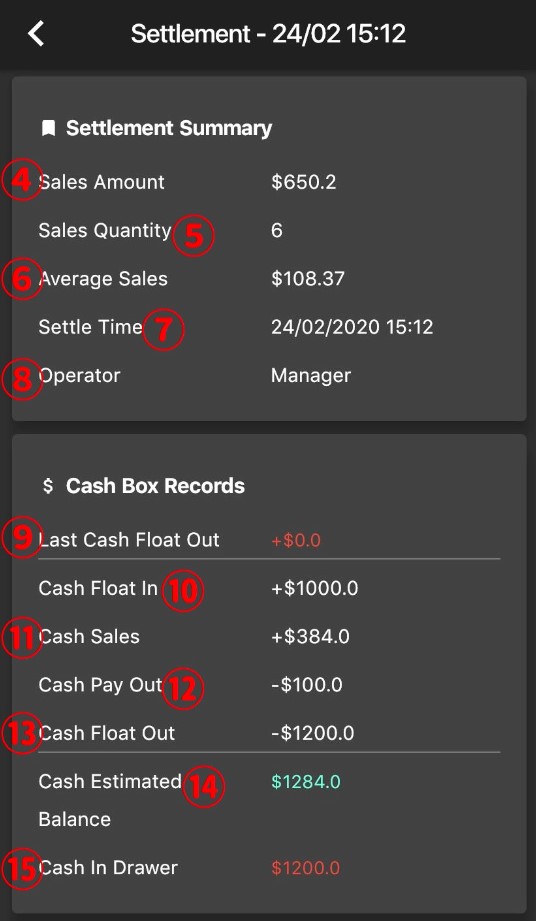
- Clicking on any single record can show the details of the sales, including:
④Sales Amount
⑤Sales Quantity
⑥Average Sales
⑦Settle Time
⑧Operator
⑨Last Cash Float Out
⑩Cash Float In
⑪Cash Sales
⑫Cash Pay Out
⑬Cash Float Out
⑭Cash Estimated Balance
⑮Cash In Drawer
*If any data is shown in red, that means the cash in the Drawer is different from the correct amount. The investigation should be done to check if there are any inappropriate operations or missing records.
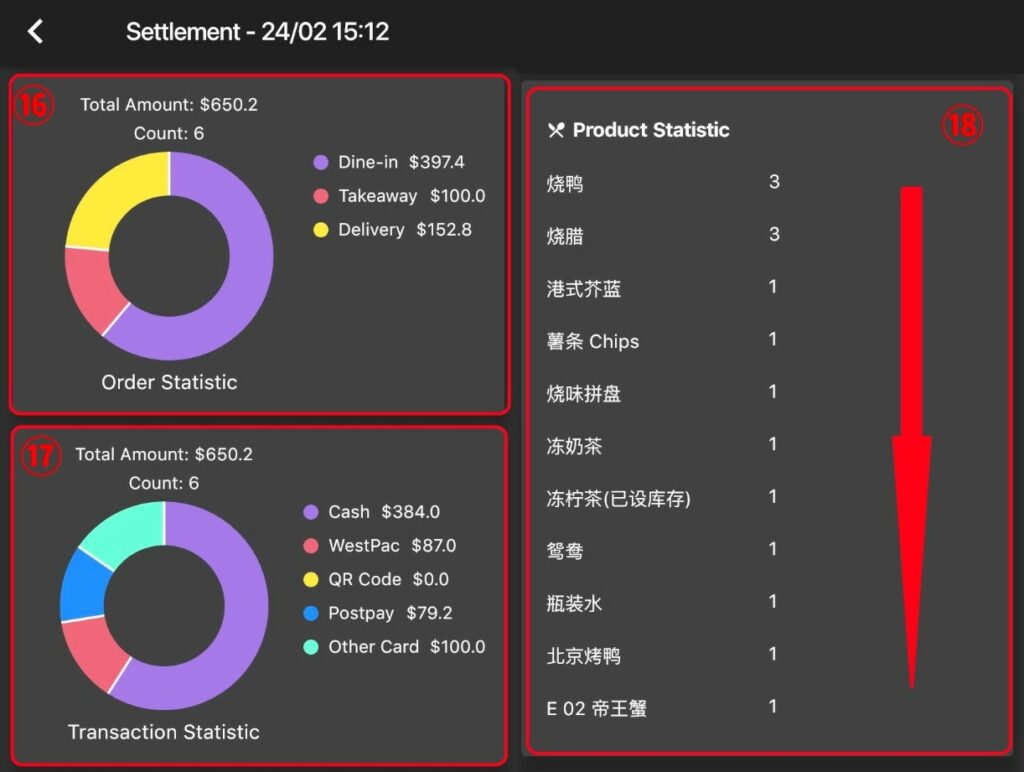
- Statistics on daily sale
⑯The revenue proportion of order type: The pie chart shows the revenue proportion of different order types, including Dine-in, Takeaway and Delivery.
⑰The revenue proportion of payment methods: The pie chart shows the revenue proportion of different payment methods, including cash, bankcard, QR code, Postpay and others.
⑱Product statistic: The ranking of dish sales volume
5. Table #
Quick setting of tables
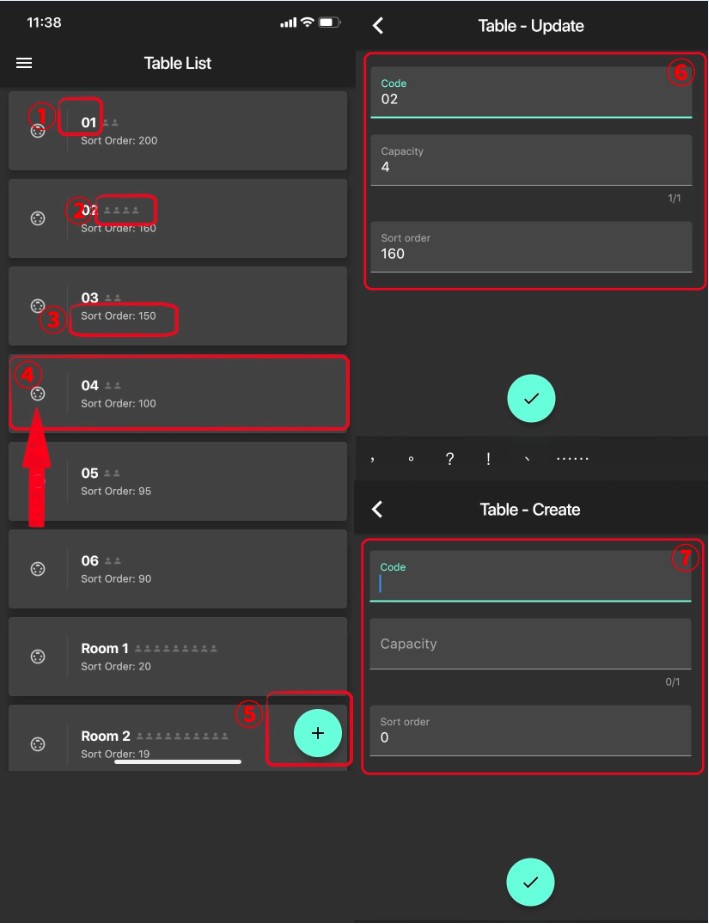
- The table list is shown when the table tag is chosen.① to represent the table number and ② represents people the table can accommodate,③ is the table ranking number, which table is shown forward with a bigger ranking number.
- Click on (⑥) to edit the table number, people the table can accommodate and ranking number.
- A new table can be added by clicking the + at the top-right corner(⑤). The table creates a menu will pop up. (⑦)
6. Order #
Statistics of order can be searched by different dates.
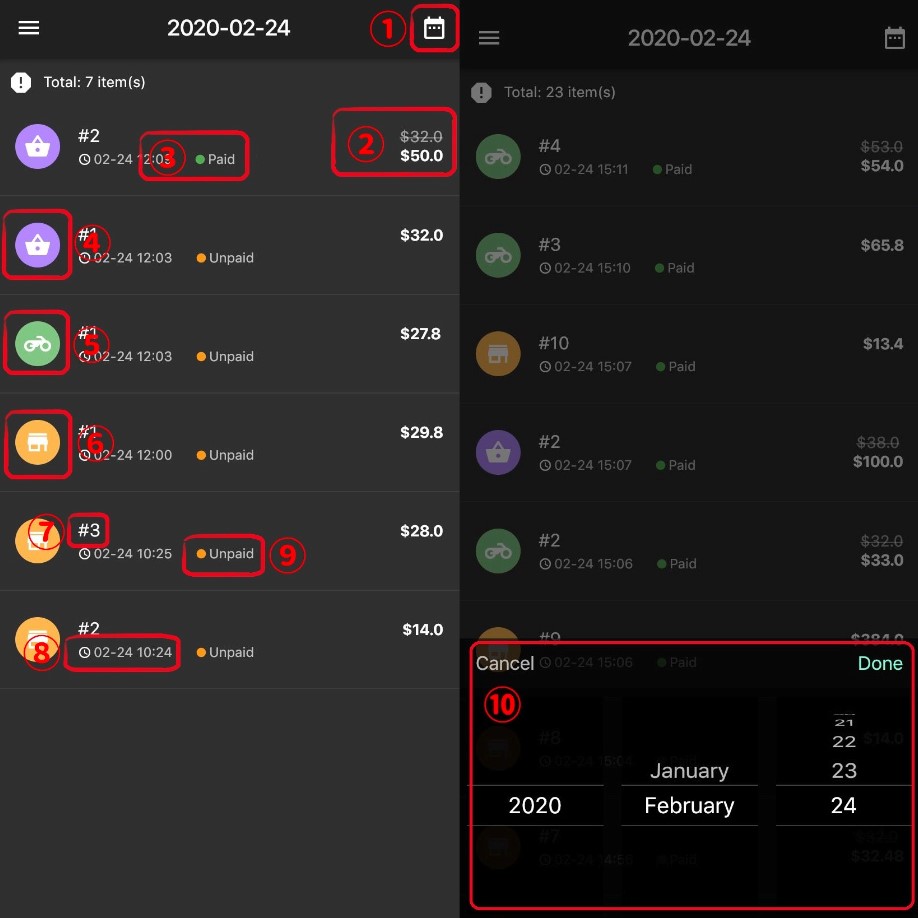
- Click on the calendar icon in the top-right corner. (①) Then choose the date(⑩)
- The amount in grey (2)shows the original order amount and the amount in white shows the actual amount received. The extra fee, such as delivery fee, and processing fee, is added to the original amount and shown in white. (②)
- The order that has been paid is shown in green (③), Otherwise, the order is shown in orange(⑨)
- The different icon on the left of the order shows the different type of order, for example, pick up(④), delivery(⑤) and dine in(⑥)
- The # number shows the ranks in the same type of order. For example, #1, and #2 show first and second orders in dine-in(⑦) and the order time is shown below the ranking number. (⑧)
The detail of the order can be shown by clicking on the order, including order detail, payment detail and delivery information if the order is delivered or picked up.
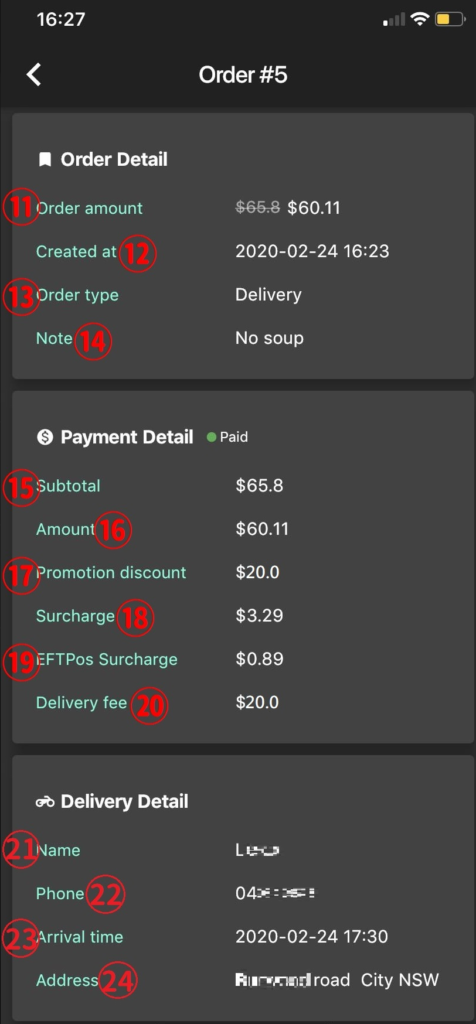
- order information includes order amount ( the amount in grey with a slash is the original amount and the amount in white shows the final settlement amount after deducted discount or add surcharge. (⑪)), order generating time(⑫), order type(⑬) and order notes(⑭)
- Payment detail shows the original amount(⑮)and settles amount (⑯). The discount is shown as ⑰ if promotion is available; Surcharge is shown as ⑱; credit card surcharge is shown as ⑲; delivery fee is shown as ⑳ if any delivery fee is applicable.
- Delivery detail is only applicable to delivery orders and pick-up orders. The name 21, contact number22, estimated arrival time23 and delivery address24 are listed under this column.
7. Product #
The basic set of dishes can be edited.
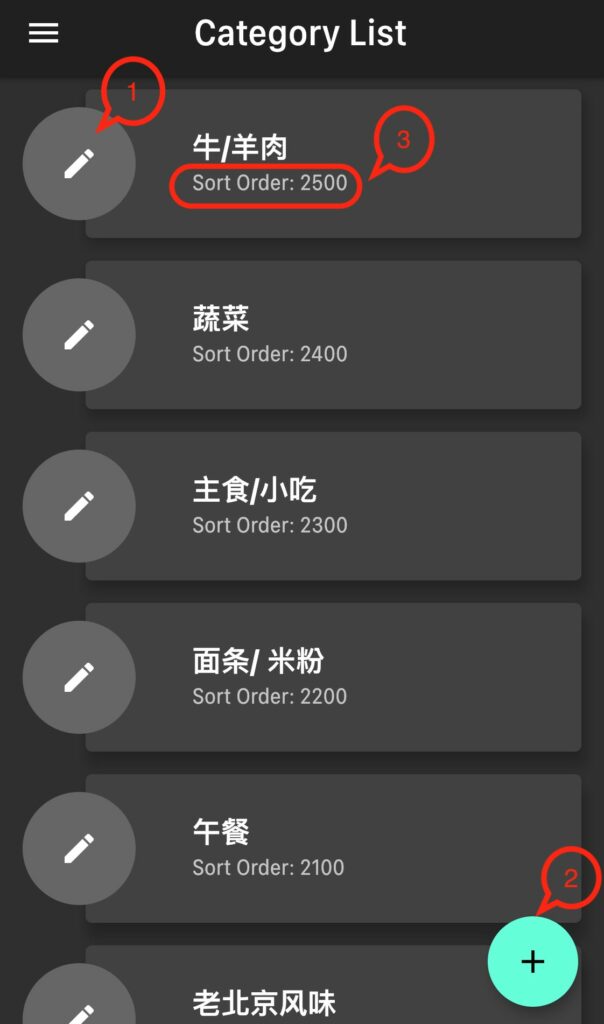
- The category list shows all current categories of dishes. The category name and ranking can be edited (1)and also be added (2)
Sort Order is the ranking of category which the bigger number set the category as forward.(③)
- Click on the category, and dishes under this category are listed. The dish price is shown under the name of the dish and the active and draft status are on the right side. Active means the dish can be seen on the menu, whereas draft means dishes can be edited but not available on the menu.
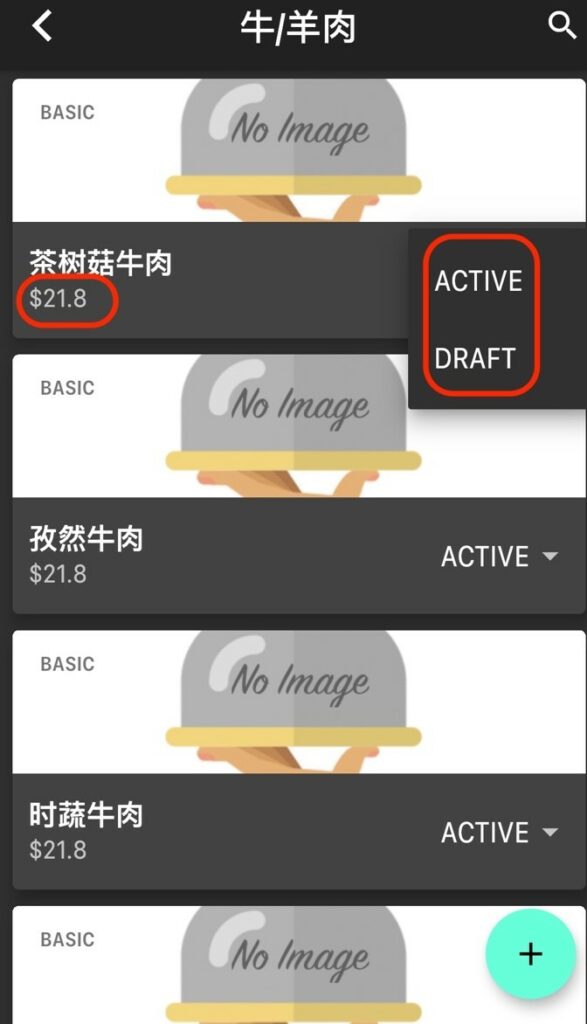
- The dish can be edited by clicking the dish
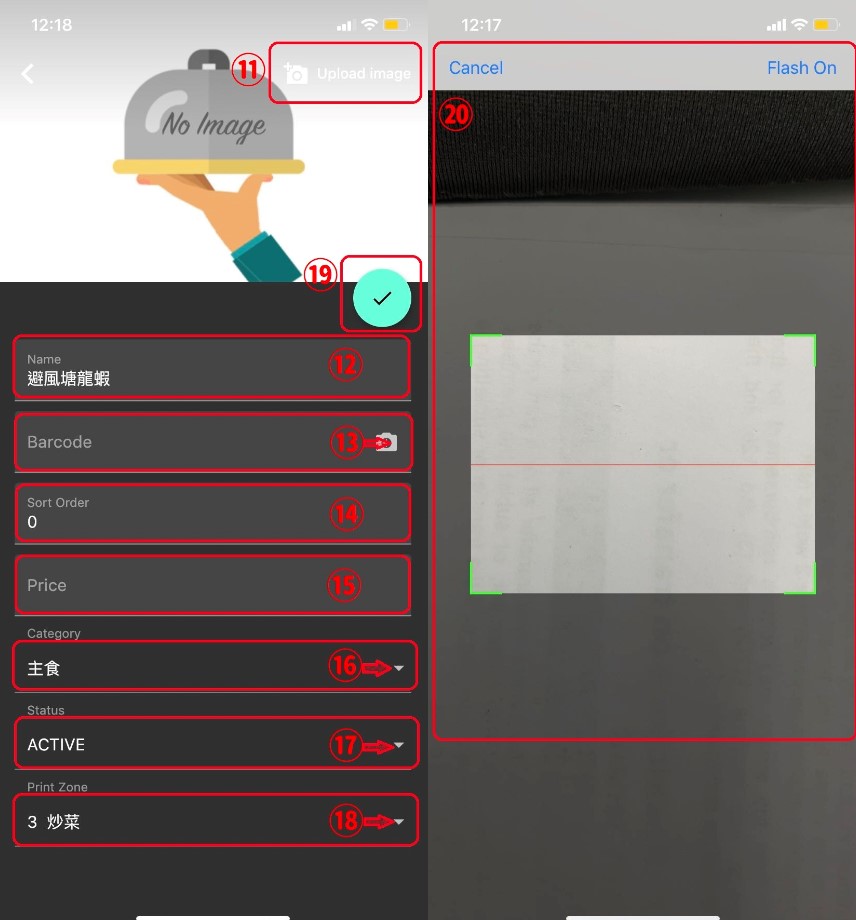
- A new dish can be added by clicking +(⑩)
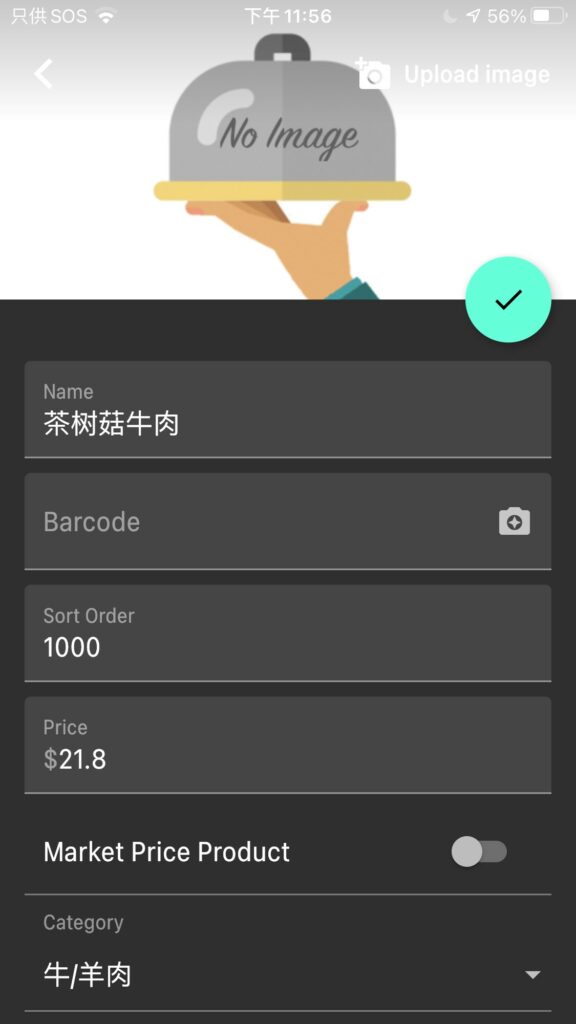
⑪ Add or edit the photo of a dish
⑫ Add or edit the name of a dish
⑬ Add or edit the barcode of a dish. Clicking the camera icon, the camera pops up (⑳), after scanning the barcode and clicking on flash on to confirm the addition
⑭Add or edit the rank of a dish. A bigger number means a higher ranking.
⑮ Add or edit the sale price of a dish
⑯ Click on the arrow on the right to add or edit the category.
⑰Click on the arrow on the right to set the category active or draft.
⑱ Click on the arrow on the right to set the print zone.
⑲ Click on the tick to confirm any change.
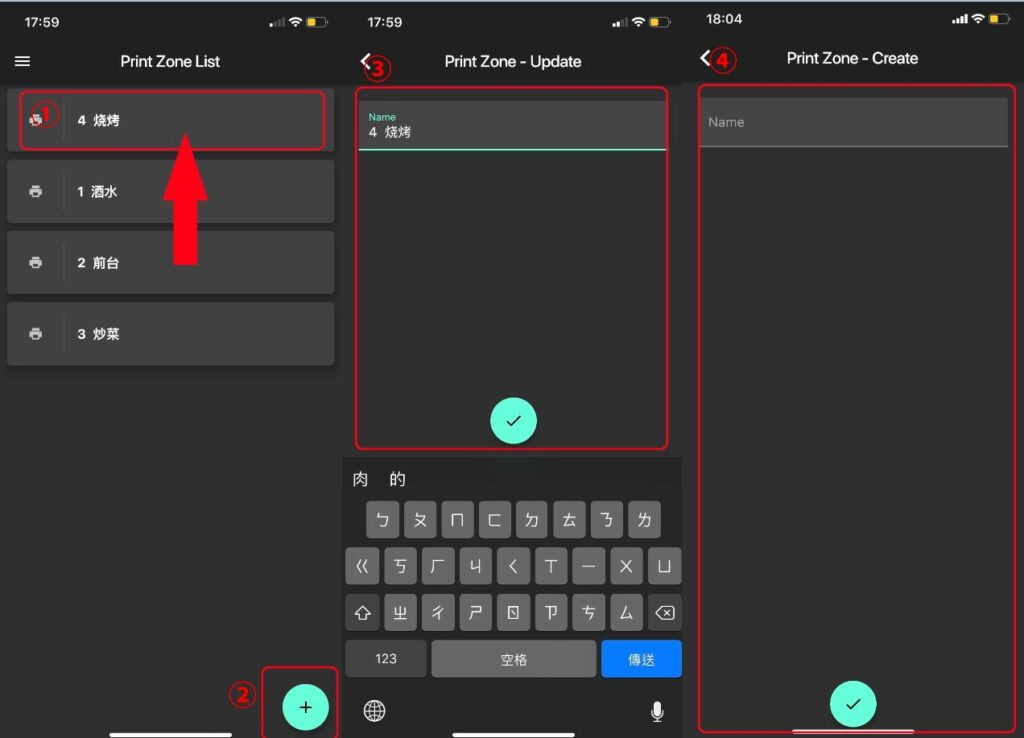
8. Print zone #
The print zone can be added and edited
(1) Click on the print zone(①) and then edit the name of the current print zone. (③) After the editing, click on the tick icon to confirm the change.
(2) Click +(②) to add a new print zone(④). After adding, click on the tick icon to confirm the change.